Lena Burdick

I am a data-driven professional who is interested in projects that combine mathematical analysis with creative design.
Here, I hope to highlight some of my projects.
View My LinkedIn Profile
View My Upwork Profile
Economic Modeling For REAP
Project Description:
REAP is a nonprofit that promotes renewable energy development in Alaska. I was brought in to develop an economic model to assess the impact of proposed legislation which would increase the state’s renewable energy use to 80%.
Policy Research
How would the proposed policy interact with pre-existing tax incentives and regulations? What are the specifics of the policy, and how do they relate to our calculations?Data Gathering
How do we translate existing data into meaningful predictions? Where do we find this data, and how do we fill in the gaps?Data Cleaning and Project Organization
Some portions of the project had been developed by people who had since left. How can we interpret portions of the project that do not have documentation and reconstruction their function? How do we build this documentation and reformat the user interface to make the tool easier for future users?Mathematical Modeling
How do we model intersecting scenarios and ensure flexibility across inputs?Data Visualization
How do we build visualization that are both useful for analysts and easy for legislators to interpret?Why Excel?
This project was developed in Excel because of preexisting company infrastructure. While there may be programming languages or modeling software better suited to the technical aspects of this project, Excel was the best tool on a practical level. This ensured the tool is easily editable & integrated with company resources.
Simplified Model Structure
View Detailed Model Structure
Workbooks
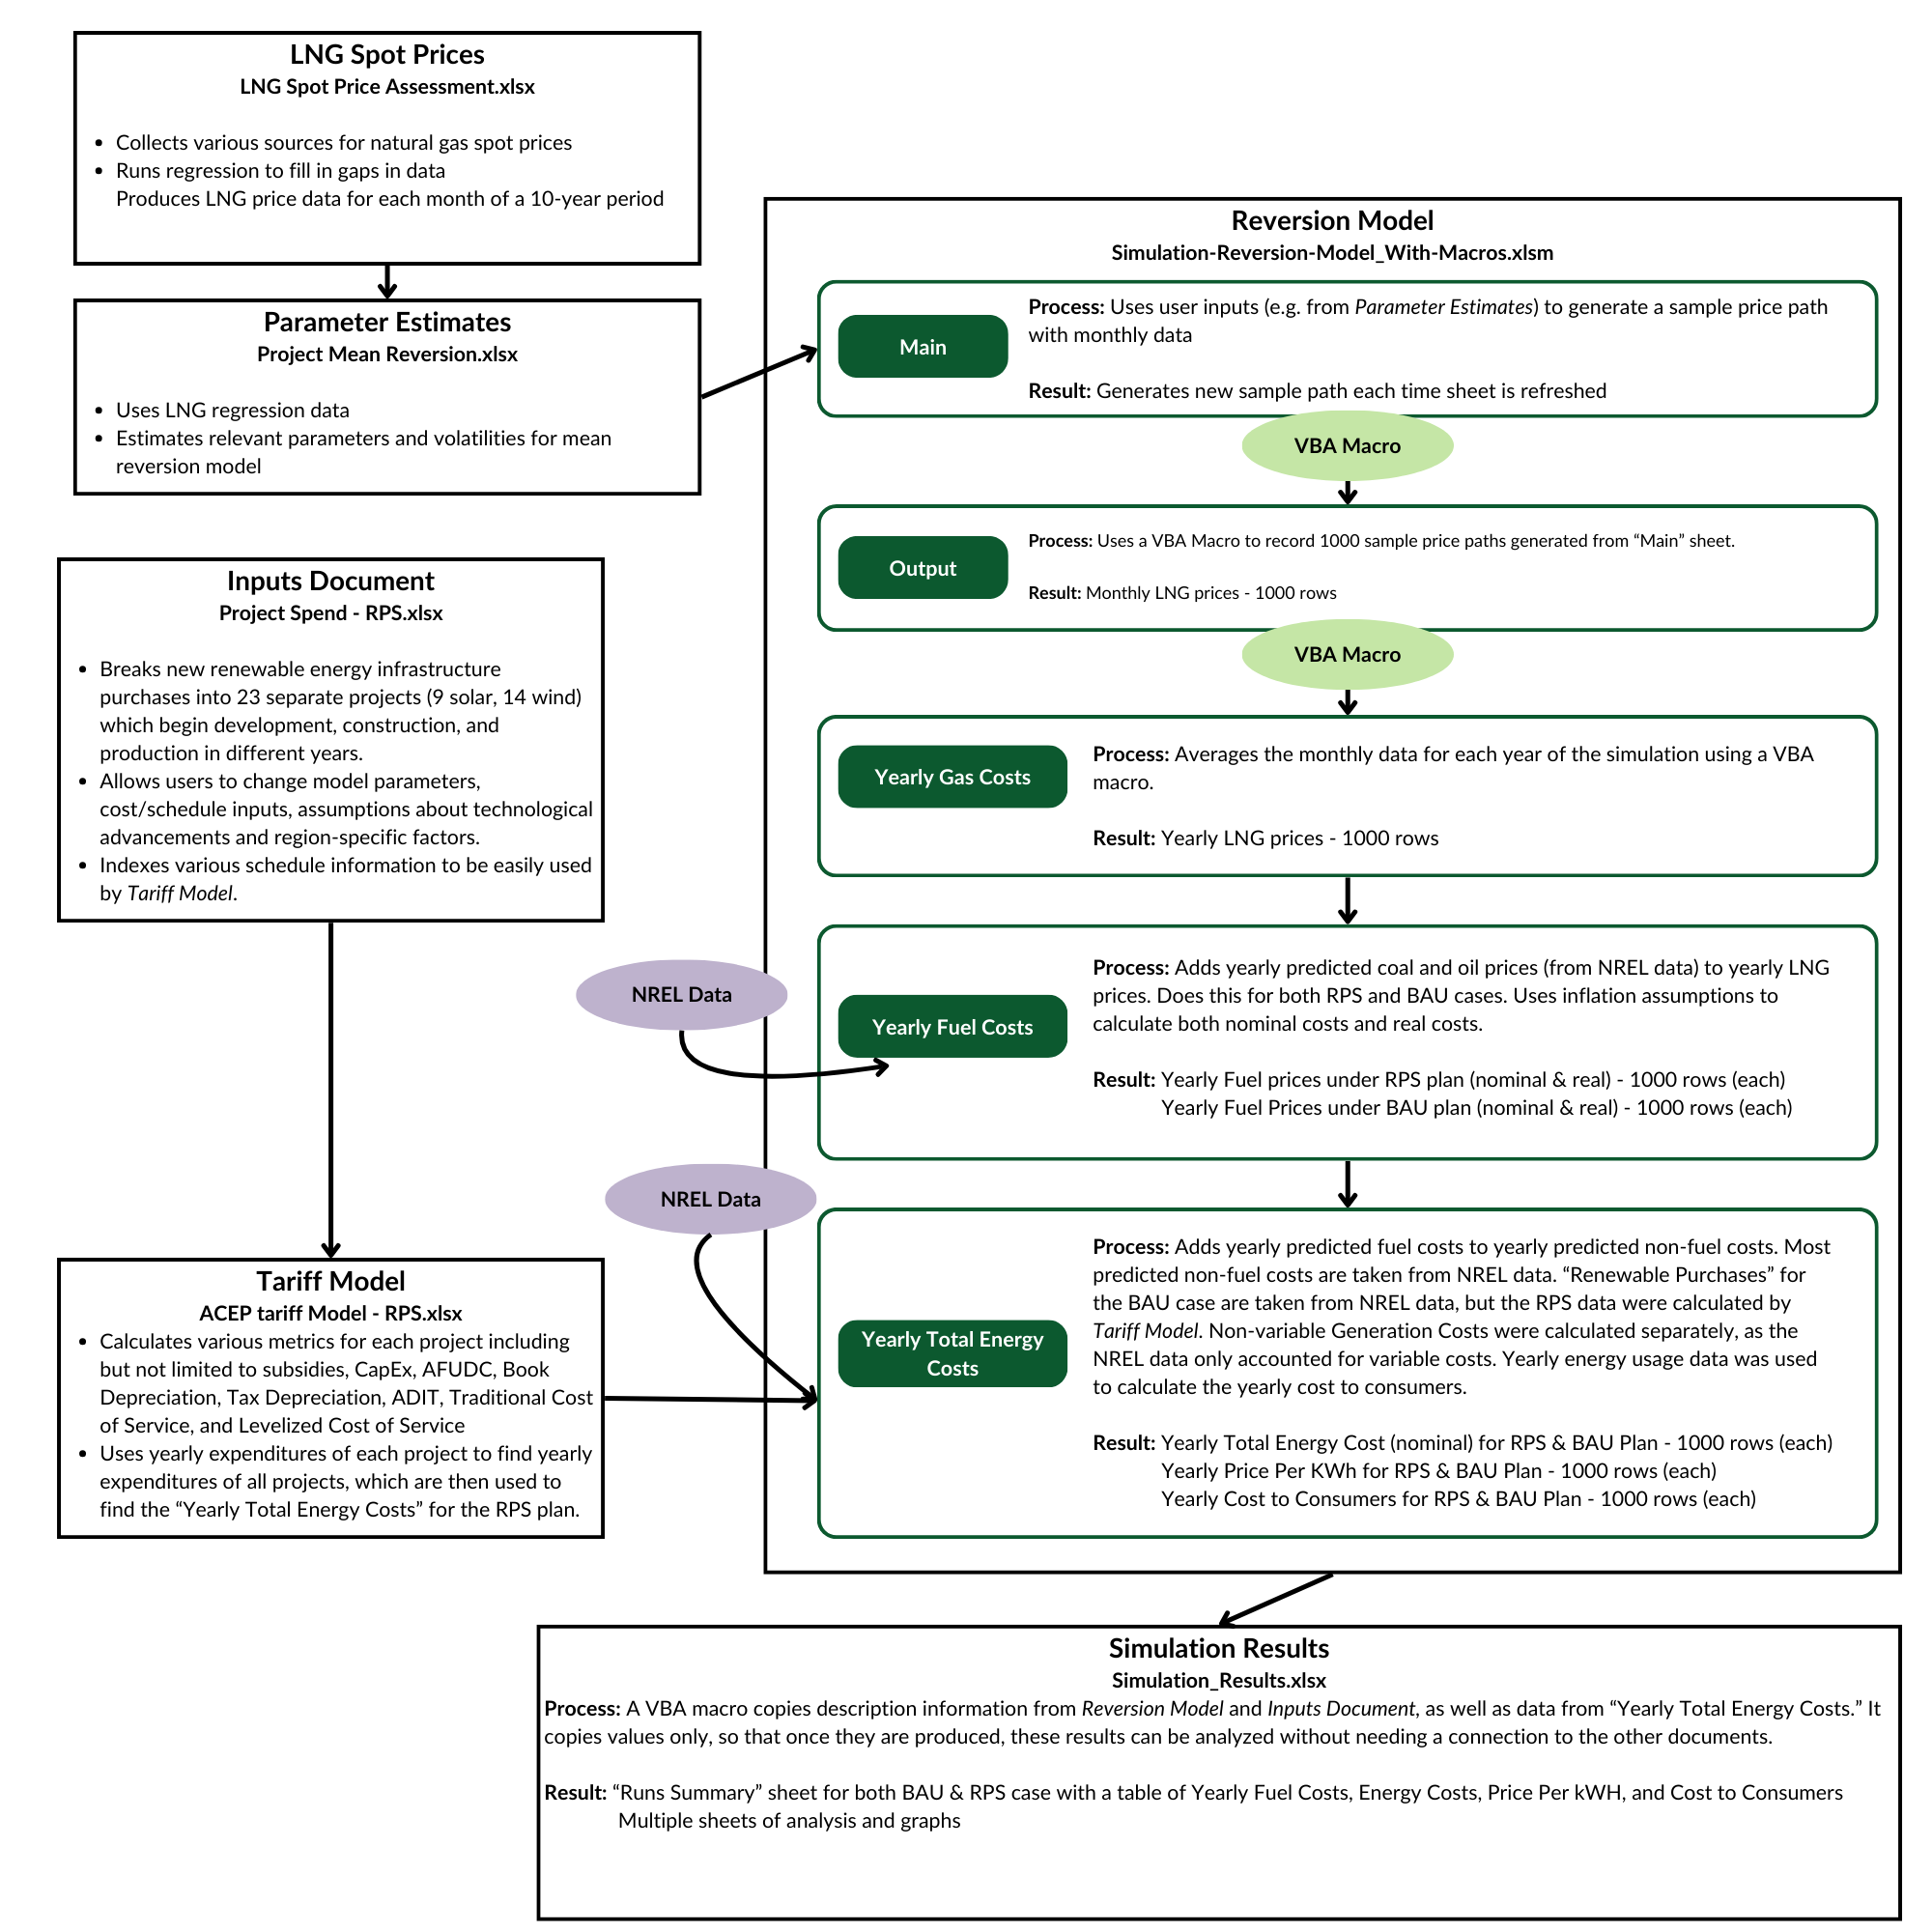
LNG Spot Prices
- Collects various sources for natural gas spot prices
- Runs regression to fill in gaps in data
- Produces LNG price data for each month of a 10-year period
Parameter Estimates
- Uses LNG regression data
- Estimates relevant parameters and volatilities for mean reversion model
Inputs Document
- Breaks new renewable energy infrastructure purchases into 23 separate projects (9 solar, 14 wind) which begin development, construction, and production in different years.
- Allows users to change model parameters, cost/schedule inputs, assumptions about technological advancements and region-specific factors.
- Indexes various schedule information to be easily used by Tariff Model.
Tariff Model
- Calculates various metrics for each project including but not limited to subsidies, CapEx, AFUDC, Book Depreciation, Tax Depreciation, ADIT, Traditional Cost of Service, and Levelized Cost of Service
- Uses yearly expenditures of each project to find yearly expenditures of all projects, which are then used to find the “Yearly Total Energy Costs” for the RPS plan.
Reversion Model
This is the project’s main model. It includes several sheets which build ontop of one another to produce final results.
Main
Process: Uses user inputs (e.g. from Parameter Estimates) to generate a sample price path with monthly data
Result: Generates new sample path each time sheet is refreshed
Output
Process: Uses a VBA Macro to record 1000 sample price paths generated from “Main” sheet.
Result: Monthly LNG prices - 1000 rows
Yearly Gas Costs
Process: Averages the monthly data for each year of the simulation using a VBA macro.
Result: Yearly LNG prices - 1000 rows
Yearly Fuel Costs
Process: Adds yearly predicted coal and oil prices (from NREL data) to yearly LNG prices. Does this for both RPS and BAU cases. Uses inflation assumptions to calculate both nominal costs and real costs.
Result:
- Yearly Fuel prices under RPS plan (nominal & real) - 1000 rows (each)
- Yearly Fuel Prices under BAU plan (nominal & real) - 1000 rows (each)
Yearly Total Energy Costs
Process: Adds yearly predicted fuel costs to yearly predicted non-fuel costs. Most predicted non-fuel costs are taken from NREL data. “Renewable Purchases” for the BAU case are taken from NREL data, but the RPS data were calculated by Tariff Model. Non-variable Generation Costs were calculated separately, as the NREL data only accounted for variable costs. Yearly energy usage data was used to calculate the yearly cost to consumers.
Result:
- Yearly Total Energy Cost (nominal) for RPS & BAU Plan - 1000 rows (each)
- Yearly Price Per KWh for RPS & BAU Plan - 1000 rows (each)
- Yearly Cost to Consumers for RPS & BAU Plan - 1000 rows (each)
Simulation Results
Process: A VBA macro copies description information from Reversion Model and Inputs Document, as well as data from “Yearly Total Energy Costs.” It copies values only, so that once they are produced, these results can be analyzed without needing a connection to the other documents.
Result:
- “Runs Summary” sheet for both BAU & RPS case with a table of Yearly Fuel Costs, Energy Costs, Price Per kWH, and Cost to Consumers
- Multiple sheets of analysis and graphs
VBA Macros
Many macros were used for this model. Here is a sampling of a couple important ones.
Simple Monte Carlo Simulation
Sub MonteCarloSimulation()
    Dim ws As Worksheet
    Dim outputWs As Worksheet
    Dim i As Integer
    Dim numRuns As Integer
    Dim lastRow As Long
    Dim j As Integer
    Dim dateTimeStr As String

    ' Set your worksheets
    Set ws = ThisWorkbook.Sheets("Main")
    Set outputWs = ThisWorkbook.Sheets("Output")

    ' Get the number of runs from cell B3
    numRuns = ws.Range("B3").Value

    ' Find the next empty row in the output sheet
    lastRow = outputWs.Cells(outputWs.Rows.Count, 1).End(xlUp).Row + 1

    ' Print the date and time
    dateTimeStr = "Simulation run " & Format(Now, "MM/DD/YYYY") & " at " & Format(Now, "hh:mm AM/PM")
    outputWs.Cells(lastRow, 1).Value = dateTimeStr

    ' Print rows 3-13 from the input sheet in the original format
    ws.Rows("3:13").Copy Destination:=outputWs.Cells(lastRow + 1, 1)

    ' Update lastRow to where rows 14 and 15 should be pasted
    lastRow = lastRow + 11

   ' Row 14 - data once
    For j = 1 To 60
        outputWs.Cells(lastRow + 1, j + 1).Value = ws.Cells(14, j).Value ' Data in columns B to BI
    Next j

    ' Row 15 - data once
    For j = 1 To 60
        outputWs.Cells(lastRow + 2, j + 1).Value = ws.Cells(15, j).Value ' Data in columns B to BI
    Next j
    ' Add two blank cells in between (columns BJ and BK)
    outputWs.Cells(lastRow + 2, 62).Value = ""

    ' Add a blank row after copying rows 14 and 15
    outputWs.Cells(lastRow + 3, 1).EntireRow.Insert

    ' Update lastRow to the new last empty row
    lastRow = lastRow + 3

    ' Loop the number of times specified in B3
    For i = 1 To numRuns
        ' Refresh the random values in row 16
        ws.Calculate

        ' Record the run number in column A
        outputWs.Cells(lastRow, 1).Value = i

        ' Copy the results from row 18
        For j = 1 To 60
            outputWs.Cells(lastRow, j + 1).Value = ws.Cells(18, j).Value
        Next j

        ' Move to the next row for the next iteration
        lastRow = lastRow + 1
    Next i

    MsgBox "Monte Carlo simulation completed and results recorded.", vbInformation
End Sub
Averaging Monthly Gas Costs to Yearly Gas Costs
Sub UpdateYearlyGasCosts() 'This macro averages the monthly data by year and prints it in the "Yearly Gas Costs" sheet
    Dim yearlyWs As Worksheet
    Dim outputWs As Worksheet
    Dim mainWs As Worksheet
    Dim numYears As Long
    Dim runIndex As Long
    Dim yearIndex As Long
    Dim currentRow As Long
    Dim lastOutputRow As Long
    Dim colIndex As Long
    Dim averageValue As Double
    Dim cell As Range
    Dim yearColumns As Collection
    Dim runColumn As Long
    Dim runLabelRow As Long
    Dim dateTimeString As String
    Dim i As Long

    TurnEverythingOff

    ' Define your sheets
    Set yearlyWs = ThisWorkbook.Sheets("Yearly Gas Costs") ' "Yearly Gas Costs" sheet
    Set outputWs = ThisWorkbook.Sheets("Output") ' "Output" sheet
    Set mainWs = ThisWorkbook.Sheets("Main") ' "Main" sheet where the number of years is specified

    ' Delete all existing data in "Yearly Gas Costs" except the first two rows
    yearlyWs.Rows("3:" & yearlyWs.Rows.Count).ClearContents

    ' Print "Simulation run on [date] at [time]" in row 3
    dateTimeString = "Simulation run on " & Format(Date, "mm/dd/yyyy") & " at " & Format(Time, "h:mm ampm")
    yearlyWs.Cells(3, 1).Value = dateTimeString

    ' Insert a new blank column between A and B
    yearlyWs.Columns("B").Insert Shift:=xlToRight

    ' Get the number of years from cell B4 in "Main" sheet
    numYears = mainWs.Range("B4").Value

    ' Add "Run =" in cell B4 of "Yearly Fuel Costs"
    yearlyWs.Cells(4, 2).Value = "Run = "

    ' Label row 4 with the run numbers starting from column C
    runLabelRow = 4
    runColumn = 3 ' Run numbers start in column C after the blank column

    ' Loop through rows in "Output" for the run numbers
    currentRow = 17
    lastOutputRow = outputWs.Cells(outputWs.Rows.Count, 1).End(xlUp).Row
    For runIndex = currentRow To lastOutputRow
        yearlyWs.Cells(runLabelRow, runColumn).Value = outputWs.Cells(runIndex, 1).Value ' Run number from "Output" column A
        runColumn = runColumn + 1
    Next runIndex

    ' Add "Year =" in cell A5 of "Yearly Fuel Costs"
    yearlyWs.Cells(5, 1).Value = "Year ="

    ' Now add years in column A starting from row 6
    For yearIndex = 0 To numYears
        yearlyWs.Cells(yearIndex + 6, 1).Value = yearIndex
    Next yearIndex

    ' Now process each run and year for data
    runColumn = 3 ' Start at column C for runs in row 6 and below

    ' Loop through each row starting from row 17 in "Output" (each run of simulation)
    For runIndex = currentRow To lastOutputRow
        ' Loop through each year to compute or copy the relevant data for each year
        For yearIndex = 0 To numYears
            If yearIndex = 0 Then
                ' Special case for Year 0: Copy the value from column C in "Output" to the current run column
                yearlyWs.Cells(yearIndex + 6, runColumn).Value = outputWs.Cells(runIndex, 3).Value ' Column C in "Output"
            Else
                ' Regular years: Average the values for the columns in "Output" where row 16 matches the year number
                Set yearColumns = New Collection

                ' Find the columns in "Output" where row 16 matches the current year number
                For Each cell In outputWs.Rows(16).Cells
                    If cell.Value = yearIndex Then
                        yearColumns.Add cell.Column
                    End If
                Next cell

                ' Only calculate the average if there are data points for the year
                If yearColumns.Count > 0 Then
                    averageValue = 0
                    Dim columnCount As Long
                    columnCount = yearColumns.Count

                    ' Sum the values from the relevant columns in row 17 of "Output"
                    For i = 1 To yearColumns.Count
                        colIndex = yearColumns(i)
                        averageValue = averageValue + outputWs.Cells(runIndex, colIndex).Value
                    Next i

                    ' Calculate the average for the current year
                    averageValue = averageValue / columnCount
                Else
                    ' If no data points exist for this year, set average to 0
                    averageValue = 0
                End If

                ' Print the average value in the corresponding cell for the current year and run
                yearlyWs.Cells(yearIndex + 6, runColumn).Value = averageValue
            End If
        Next yearIndex

        ' Move to the next column in "Yearly Fuel Costs" for the next run
        runColumn = runColumn + 1
    Next runIndex

     ' Save Workbook
     ActiveWorkbook.Save

     TurnEverythingOn


End Sub